
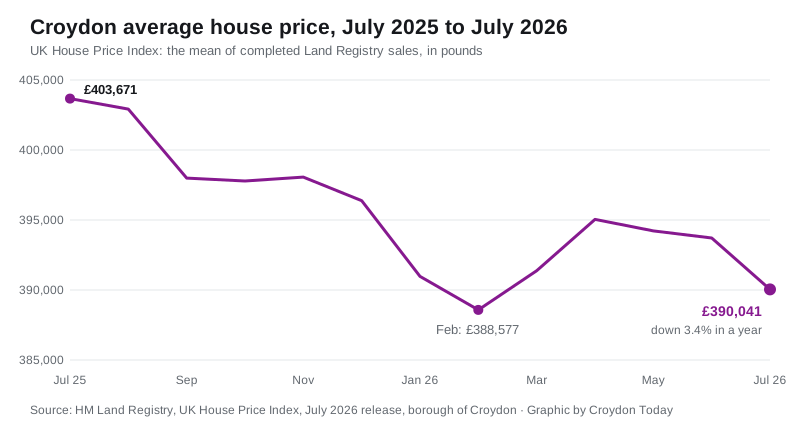
The average Croydon home sold for £390,041 in July, down £13,630 in a year. Flats are falling fastest at 5.3%, and Newham is now within £308 of Croydon.
The average home in Croydon sold for £390,041 in July 2026, down £13,630 on a year earlier, according to figures HM Land Registry published on 16 September.
That is a fall of 3.4% in twelve months, the sharpest annual drop the borough has recorded since March 2024, matched only by this January. It confirms a change of gear: a year ago Croydon’s market was still rising, and as recently as April the annual change was a dip of just 0.4%.
July 2025 turns out to have been the top of the recent market, at £403,671. Prices have given up the whole of that year’s gain and now stand £40,219 below the borough’s all-time peak of £430,260, set in January 2023.
One caution before the detail. The UK House Price Index is a mean average, not a median, so a few expensive sales pull it up. It is built from completed Land Registry sales rather than asking prices, which makes it the most reliable measure there is, but it lags: July’s completions were mostly agreed in the spring.
Flats are doing the falling
The borough average hides a clear ranking. Every property type fell over the year to July, but not evenly:
| Type | Average, July 2026 | Change on a year |
|---|---|---|
| Flat | £253,660 | -5.3% |
| Detached | £837,514 | -3.4% |
| Terraced | £396,579 | -2.1% |
| Semi-detached | £535,706 | -2.0% |
Flats, the borough’s most affordable homes and the bulk of its new-build stock, are falling more than twice as fast as the semis and terraces most families buy. A first-time buyer paid an average of £326,693, down 3.6% on the year, which is more than £12,000 less than the same purchase a year earlier.
Second cheapest in London, and Newham is £308 away
Croydon remains the second cheapest of London’s 33 boroughs, above only Barking and Dagenham at £375,604. But the gap to third is now remarkable: Newham’s average fell 5% over the year to £390,349, just £308 above Croydon’s.
Across the capital, 21 of the 33 boroughs recorded an annual fall. London as a whole averaged £550,037, down 3.3%, so Croydon is no longer outperforming the capital; it is falling at the same pace. England went the other way, up 1.1% to £293,479.
The steepest falls were in the expensive centre: Westminster down 20.7%, the City of London down 17.4%, Tower Hamlets down 14.4%. The strongest rises were at the affordable eastern and outer edges: Barking and Dagenham up 5.3%, Kingston upon Thames up 3.3%, Waltham Forest up 2.8%.
Among the immediate neighbours, Bromley fell 3.1% to £511,670, Lambeth fell 6.3% to £536,623, Merton slipped 0.9% to £615,890, and Sutton was the only riser, up 0.6% to £452,654.
The figures behind the figures
Two things worth knowing when reading this release:
- Sales volumes lag. The most recent published count is 205 sales in May 2026, because the Land Registry withholds the latest two months while records come in. The distortion from the April 2025 stamp duty change has now washed out of the annual comparisons.
- Old figures move. June’s average, published a month ago as £394,736, has been restated to £393,714 in this release, and June’s annual change has moved from -1.9% to -2.2%. Every UKHPI release revises earlier months as late sales are registered, so a figure you saved in August will not match today’s series.
What it means for you
If you are selling, the market has turned and the type you own matters most. A semi or terrace is down about 2% on the year; a flat is down more than 5%, and pricing a flat off last year’s sold prices will leave it sitting unsold.
If you are buying, this is the strongest negotiating position Croydon buyers have had since early 2024, and it is strongest on flats, where the average is £253,660. Check the council tax band before you offer; the annual bill is a real running cost here.
If you are staying put, the average Croydon home is worth about £13,600 less than a year ago in cash terms. That matters mainly if you are remortgaging near a loan-to-value threshold.
The next figures, for August 2026, are due from the Land Registry in mid October. Our Croydon house prices guide carries the standing picture: what each type costs, the priciest corners and how the borough compares.
Sources
- HM Land Registry, UK House Price Index reports, July 2026 edition, published 16 September 2026
- HM Land Registry, UK HPI full data file, July 2026 (the borough series back to 2008, the 33-borough comparison, and the London and England figures)
- HM Land Registry, UK House Price Index browser for Croydon (the July 2026 averages by property type and buyer status)
Have your say