
The average Croydon home is now £394,736, down £7,791 in a year. Only Barking and Dagenham is cheaper in London. Where the falls are, by property type.
The average home in Croydon sold for £394,736 in June 2026, down £7,791 on a year earlier, according to figures HM Land Registry published on 19 August.
That is a fall of 1.9% over twelve months, and it leaves Croydon as the second cheapest of London’s 33 boroughs. Only Barking and Dagenham, at £371,030, is lower.
Prices in the borough peaked at £403,993 in July 2025. They have drifted down almost every month since, and June’s figure is £9,257 below that peak.
One caution before the numbers. The UK House Price Index is a mean average, not a median, so a handful of expensive sales pulls it up. It is built from completed Land Registry sales rather than asking prices, which makes it the most reliable measure available, but it lags: June’s completions were mostly agreed in the spring.
Which homes are falling, and which are holding
The borough average hides a wide split by property type.
| Type | Average, June 2026 | Change on a year |
|---|---|---|
| Detached | £844,849 | -3.3% |
| Semi-detached | £541,751 | -1.1% |
| Terraced | £400,755 | -0.4% |
| Flat | £257,494 | -3.3% |
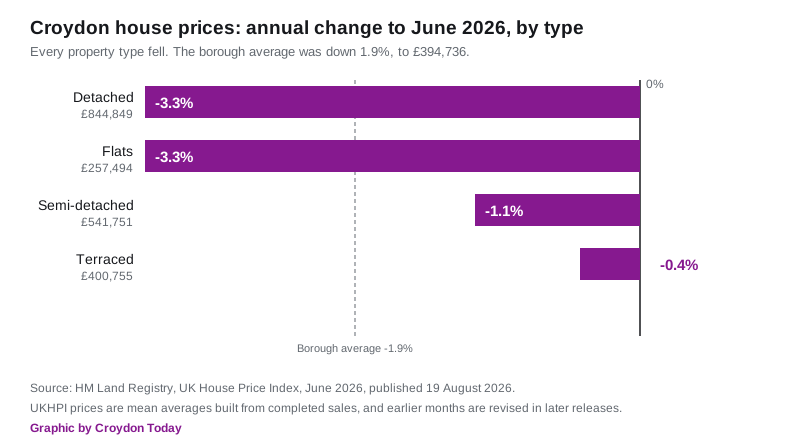
The two ends of the market are falling fastest and the middle is nearly flat. Terraced houses, the most common family purchase in Croydon, are down 0.4% in a year, which is effectively unchanged.
First-time buyers paid £330,759 on average, down 1.9%. Buyers who already owned paid £503,530, down 2.0%.
How Croydon compares
Nineteen of London’s 33 boroughs recorded a fall over the year to June, and fourteen recorded a rise. Croydon’s 1.9% dip is milder than the capital as a whole.
- London: £553,870, down 2.5%
- Croydon: £394,736, down 1.9%
- England: £293,262, up 1.8%
- United Kingdom: £272,188, up 2.0%
The steepest London falls were in the expensive centre: Westminster down 25.4%, the City of London down 20.4%, Kensington and Chelsea down 14.7%. The strongest rises were in the outer east: Barking and Dagenham up 4.3%, Havering up 3.9%, Redbridge up 3.6%.
Among Croydon’s immediate neighbours, Bromley fell 1.4% to £518,235, Merton rose 0.5% to £612,681, Sutton rose 0.4% to £446,775 and Lambeth fell 3.3% to £548,034.
The sales figures are still distorted by 2025
Sales volumes tell a different story from prices, and they need reading carefully.
Croydon recorded 760 completed sales in March 2025 and 154 in April 2025. That is not a market collapse. It is the stamp duty threshold change on 1 April 2025, which pulled a month of completions forward into March.
The comparable months this year were 241 in March 2026 and 188 in April 2026. April is the most recent month with a published sales count, because the Land Registry withholds volumes for the two most recent months while records are still coming in.
UKHPI revises, so old figures move
Our own Croydon house prices page currently carries the May 2026 average as £396,760, which is what the Land Registry published at the time. In this June release, May has been restated as £395,259, and the annual change for May moved from -0.4% to -0.7%.
That is normal. Every UKHPI release revises earlier months as late sales are registered. It is worth knowing if you are comparing a figure you saved a few weeks ago against today’s.
What it means for you
If you are selling, price to the market you are in, not the one in the headlines. Flats and detached houses are the two segments actually falling in Croydon; terraced and semi-detached homes are close to flat. Which of those you own matters more than the borough average.
If you are buying, the borough is now the second cheapest in London while sitting on fast trains to Victoria and London Bridge. Flats at an average £257,494 are down 3.3% in a year, so there is more room to negotiate there than anywhere else in the local market. Check the council tax band before you offer, since the annual bill is a real running cost.
If you are staying put, the borough average is down about 2% in a year in cash terms, and further once inflation is allowed for. That matters mainly if you are remortgaging near a loan-to-value threshold.
The next figures come on 16 September 2026, when the Land Registry publishes the July 2026 index at 9.30am.
Sources
- HM Land Registry, UK House Price Index reports, June 2026 edition, published 19 August 2026
- HM Land Registry, UK HPI full data file, June 2026, used for the borough, London, England and UK figures and the comparison with all 33 London boroughs
- HM Land Registry, UK House Price Index browser for Croydon
Have your say