
Croydon crime fell 1.6% in the year to August 2026, but weapons offences rose 42% and Broad Green shoplifting nearly tripled. All 28 wards ranked.
Police recorded 40,450 crimes across the borough of Croydon in the 12 months to August 2026, leaving out criminal damage. That is 660 fewer than the year before, a fall of 1.6 per cent.
One category went the other way. Possession of weapons offences rose by 42 per cent, from 247 to 350. Most of the rise came in 2026, and about a third of it was in Fairfield, the town centre ward.
These are our own counts from the Home Office’s police.uk open data. It publishes every crime the Metropolitan Police records, placed on a map. We added up every report inside the boundary of each of Croydon’s 28 wards for the 24 months from September 2024 to August 2026. August 2026 is the newest month police.uk has published.
Why criminal damage is left out
The Met’s published data for criminal damage and arson almost disappears from May 2026. Across Croydon it ran at between 178 and 245 reports a month until April 2026. From May it falls to single figures or just above.
| Month | Criminal damage and arson recorded in Croydon |
|---|---|
| March 2026 | 234 |
| April 2026 | 189 |
| May 2026 | 12 |
| June 2026 | 10 |
| July 2026 | 9 |
| August 2026 | 8 |
The same drop shows in the published data for Bromley, Sutton and Redbridge. That points to a gap in what the Met has sent to police.uk, not a sudden end to vandalism. The police.uk changelog had no note about it when we checked on 5 October. Counted as published, the borough’s total would show a false fall, so every figure below leaves criminal damage out of both years.
What went up, and what went down
| Type of crime | Year to Aug 2025 | Year to Aug 2026 | Change |
|---|---|---|---|
| Violence and sexual offences | 12,578 | 12,744 | up 1.3% |
| Anti-social behaviour | 8,839 | 8,679 | down 1.8% |
| Vehicle crime | 3,530 | 3,700 | up 4.8% |
| Shoplifting | 3,467 | 3,590 | up 3.5% |
| Other theft | 2,774 | 2,708 | down 2.4% |
| Public order | 2,335 | 2,394 | up 2.5% |
| Drugs | 2,569 | 2,130 | down 17.1% |
| Burglary | 1,899 | 1,696 | down 10.7% |
| Robbery | 1,126 | 982 | down 12.8% |
| Theft from the person | 930 | 779 | down 16.2% |
| Other crime | 619 | 498 | down 19.5% |
| Possession of weapons | 247 | 350 | up 41.7% |
| Bicycle theft | 197 | 200 | up 1.5% |
| Total (excluding criminal damage) | 41,110 | 40,450 | down 1.6% |
The changes worth knowing about:
- Burglary fell by 203 reports, to 1,696, down 10.7 per cent.
- Robbery fell by 144, to 982, down 12.8 per cent.
- Theft from the person fell by 16 per cent, from 930 to 779. That is pickpocketing and snatch theft.
- Drug offences fell by 17 per cent, from 2,569 to 2,130.
- Violence and sexual offences remain the largest category, at 12,744 reports, up 1.3 per cent.
August on its own saw 3,489 crimes recorded, leaving out criminal damage. That is 3.4 per cent fewer than in August 2025, when the figure was 3,612.
Weapons offences: the rise came this year
Possession of weapons is a small category, but it has risen steadily. Counted every three months, it ran at between 53 and 75 reports until February 2026. It then jumped to 99 in March to May and 106 in June to August.
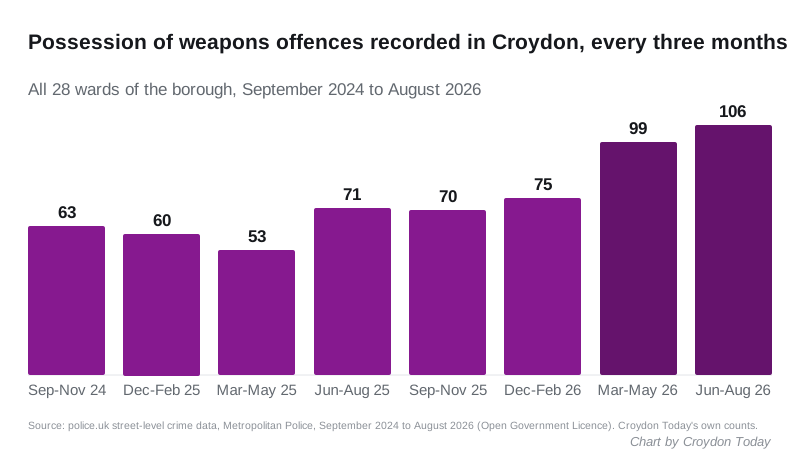
Fairfield accounts for about a third of the increase. Weapons offences there went from 37 to 73, 36 of the borough’s 103 extra reports. Smaller rises came in South Norwood (7 to 18) and Selhurst (10 to 20).
Weapons offences are mostly found by officers, often during stop and search, rather than reported by the public. A rise can mean more weapons are being carried, more searching is being done, or both. Croydon’s youth justice plan recorded a rise in stop and search on children in 2025/26, from about 930 to 1,262, which we reported in our story on the plan.
The same logic applies to drugs. A fall in recorded drug offences usually reflects less police activity aimed at drugs, not necessarily less drug use. In Sanderstead they fell from 145 to 23, and in South Croydon from 274 to 82.
Shoplifting moved, rather than rose
Borough-wide, shoplifting rose only 3.5 per cent. Inside that, a few wards swung hard, and almost every swing traces back to a single shop.
Police.uk places each crime on an approximate map point, not an exact address. The point is labelled with the nearest landmark, such as “Supermarket” or “Petrol Station”.
- Broad Green: shoplifting went from 195 to 550. Of the 550, 415 sit on one point labelled “Petrol Station”, up from 61 the year before.
- Fairfield: up from 824 to 1,088. One “Supermarket” point went from 106 reports to 505.
- Waddon: down from 563 to 145. A single “Supermarket” point that logged 344 reports in the earlier year logged just 6 in the latest one.
- Norbury and Pollards Hill: down from 405 to 198, nearly all of it at one “Supermarket” point.
- Addiscombe West: down from 257 to 117, again mostly at one “Supermarket” point.
So these are not crime waves spreading through streets. They reflect how often a handful of big shops report thefts, and how police log them. The data cannot tell us whether a given shop is seeing more theft, reporting more of it, or both.
Every ward, ranked by change
All figures leave out criminal damage, for the reason above.
| Ward | Year to Aug 2025 | Year to Aug 2026 | Change |
|---|---|---|---|
| Selsdon and Addington Village | 525 | 609 | up 16.0% |
| Shirley North | 1,116 | 1,265 | up 13.4% |
| Coulsdon Town | 917 | 1,005 | up 9.6% |
| Broad Green | 3,005 | 3,265 | up 8.7% |
| West Thornton | 2,538 | 2,712 | up 6.9% |
| Thornton Heath | 1,823 | 1,918 | up 5.2% |
| Shirley South | 644 | 664 | up 3.1% |
| Old Coulsdon | 505 | 520 | up 3.0% |
| Fairfield | 6,222 | 6,368 | up 2.3% |
| Crystal Palace and Upper Norwood | 1,352 | 1,378 | up 1.9% |
| Selhurst | 1,652 | 1,683 | up 1.9% |
| South Croydon | 1,664 | 1,677 | up 0.8% |
| New Addington North | 770 | 773 | up 0.4% |
| South Norwood | 1,825 | 1,821 | down 0.2% |
| Purley Oaks and Riddlesdown | 643 | 638 | down 0.8% |
| Park Hill and Whitgift | 386 | 378 | down 2.1% |
| Bensham Manor | 1,434 | 1,401 | down 2.3% |
| Purley and Woodcote | 1,527 | 1,485 | down 2.8% |
| Kenley | 531 | 512 | down 3.6% |
| Addiscombe East | 966 | 925 | down 4.2% |
| Norbury Park | 747 | 707 | down 5.4% |
| Woodside | 1,578 | 1,476 | down 6.5% |
| Selsdon Vale and Forestdale | 657 | 600 | down 8.7% |
| New Addington South | 1,152 | 1,035 | down 10.2% |
| Sanderstead | 664 | 556 | down 16.3% |
| Norbury and Pollards Hill | 1,493 | 1,233 | down 17.4% |
| Waddon | 2,905 | 2,371 | down 18.4% |
| Addiscombe West | 1,869 | 1,475 | down 21.1% |
Fairfield, which covers the town centre, records far more crime than any other ward: 6,368 reports, about one in six of the borough total. Busy town centres always top these tables, because that is where people shop, travel and go out.
Selsdon and Addington Village had the biggest percentage rise, from a low base. Violence and sexual offences there went from 163 to 219, and shoplifting from 3 to 34.
Shirley North was second, up 13.4 per cent. Shoplifting rose from 209 to 280, burglary from 37 to 67 and violence and sexual offences from 291 to 352.
Addiscombe West and Waddon had the biggest falls, mostly because of the shoplifting changes above.
How to read these figures
- Police.uk places every crime on an approximate map point. A crime near a ward edge can be counted in the neighbouring ward.
- These are recorded crimes. A change can mean more crime, more reporting, or more police activity.
- Ward boundaries are the Met’s neighbourhood boundaries, which match Croydon’s 28 wards.
- A small number of crimes each month are published with no location and are not counted here.
What it means for you
- Check your own street. The police.uk crime map shows the latest month for any postcode, with your Safer Neighbourhood Team and its priorities.
- Report every theft if you run a shop. The figures show how far one site’s reporting moves a ward’s numbers, and patrols are planned from that map.
- To report a crime, call 101 or use the Met’s online reporting. In an emergency, call 999.
Our Croydon house prices guide has the other side of what each part of the borough is like to live in.
Sources
- police.uk open data API: street-level crimes and Metropolitan Police neighbourhood boundaries for Croydon’s 28 wards, September 2024 to August 2026, Open Government Licence. All counts and percentages are Croydon Today’s own, drawn from that data on 5 October 2026.
- police.uk changelog, checked 5 October 2026 for any notice on the Met’s criminal damage data (none found).
Have your say